
if you are looking to learn about technical analysis of stock in NEPSE then you are at the right place. Here you will learn about how NEPSE alpha technical analysis is carried out in the stoct and you will also learn about the strategies that will generate nepse alpha trading signal to buy and sell the stock.
What is NEPSE Technical Analysis
Before starting the analysis, it is important to understand the technical analysis So what is technical analysis?
According to Investopedia.com,
“It is a method of evaluating statistical trends in trading activity.”
But for me, it is a method used to evaluate and forecast future price of any stock. Since we are analyzing the stock, the definition is based on the stock; however, technical analysis can be used in commodities or cryptocurrencies. Its emphasis on patterns, trends and market behavior. There are various tools and concepts used in technical analysis and they are:
Price chart: it is the graphical representation of a stock price over time, such as candlestick, bar chart, etc.
Trends: Trends means movement of the price. Trends are two types: upward trend (bullish) and download trend (bearish).
Support and resistance: Support is the price level in the stock chart where the price have reversed up due to strong buying by the investor or trader, while resistance is the price level from which the price have reversed down due to heavy selling by investors and traders.
Chart Patterns: chart patterns are some formation in the chart created by the price; this is due to the buying and selling behavior of traders and investors.
Volume analysis: volume provides insights into strength or weakness of the price movement. Therefore, volume confirms a trend
Benefit of Nepse alpha technical analysis
There are many benefits of technical analysis and some of them are as follows:
- It is quick and easy.
- It incorporates both psychological and economic aspect behind price change
- It tells when to buy and sell the stock.
- It does not require financial statement or accounting.
Here we will perform the technical analysis of the MHL company that is listed in the Nepal stock exchange.
MHL stands for Mandakini Hydropower limited company.
History of MHL
Founded with the goal of creating, owning, and running a hydroelectric facility in Nepal The Sardi Khola Hydropower Station is owned by Mandakini Hydropower Pvt. Ltd., an Independent Power Producers Association Nepal (IPP) in Nepal.
It is a hydroelectric run-of-river facility in Nepal’s Kaski District. Four megawatts of power are produced from the flow of the Sardi River. The facility began producing power on August 23, 2074, BS.
After the generating license expires on 2105-03-12 BS, the government will take control of the facility. The power plant sells its energy to Nepal energy Authority and is linked to the national grid.
(Source: Nepsealpha)
READ ALSO – Tips to earn money online from Nepal Stock Exchange(NEPSE)
General information on the MHL
Market capitalization: NPR 4,647,483,485
Free-Float Market Capitalization: NPR 910,907,251.98
Promoter Holding: 70%
Public Holding: 19%
Locked Holding: 10.40%
Installed Capacity: 4.00MW
Nepse Technical Analysis Chart MHL
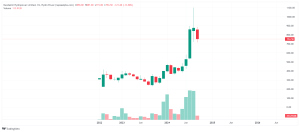
In the monthly chart of nepse alpha technical analysis, we can see that the price has moved up by 367% from September 2023 to August 2024. The lowest price during this period was Rs. 232, while the highest was Rs. 1100. Currently, the price is trading at Rs. 754.
When the price crossed its all-time high resistance of 404 in January 2024, it started an upward movement, eventually reaching Rs. 1100 and becoming a multibagger.
Nepse Technical Chart Buy Signal
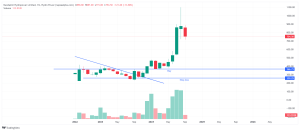
Based on the analysis of trendlines, you should have bought the stock at around 366, with a stop loss set at 259.29. The reason for buying at around 366 is that the price broke through a strong resistance level, confirmed by a trendline breakout candle. Additionally, the breakout was accompanied by high volume, further validating the nepse alpha technical analysis and marking this as an ideal buying zone.
Nepse Alpha Technical Analysis Buy Signal MHL
It’s important to note that stock analysis isn’t always 100% accurate. MHL may have risen due to positive market sentiment at the time, but that may not always be the case. To protect against fake breakouts, investors or traders should use a position sizing strategy. For instance, if you had Rs. 100,000 to invest, instead of buying the stock all at once, you could start by investing Rs. 30,000. Then, as the stock pulls back or breaks out on lower time frames, or when resistance levels are broken, you could add Rs. 10,000 increments. At the same time, you should also adjust your stop loss upward to lock in profits and protect yourself from potential losses.
READ ALSO – Easy way of make money online in Nepal
Nepse Alpha Technical Analysis Sell Signal MHL
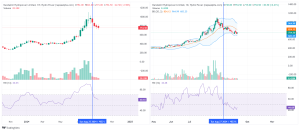
Since the stock reached Rs. 1100, some traders or investors might have taken profits or considered exiting their positions. According to technical analysis, traders or investors should have exited in August 2024. At that time, on the daily chart (as shown in the image above), the price crossed a lower low and also broke below the middle band of the lower Bollinger Band.
Additionally, if you look at the RSI, the weekly RSI shows a decline, indicating that the trend is losing strength. On the daily time frame, the RSI has already dropped to 50, which is a further indication of weakening momentum and suggests that the price may fall further.
Disclaimer – “The content on this site is provided solely for educational purposes to empower users to make informed financial decisions. We do not recommend buying or selling decisions. We are not responsible for any loss of capital incurred by readers based on the actions they take using our information.”
Also Read:
- 10 useful website for investing in Nepal
- What is position sizing and how does it help
- Tips to control loses in Nepal stock market
- Roles of sebon in protecting nepal stock market